 MENU
MENUHow to Graph Quadratic Functions(Parabolas)?
To draw the graph of a function in a Cartesian coordinate system, we need two perpendicular lines xOy (where O is the point where x and y intersect) called "coordinate axes" and a unit of measurement.

A point in this system has two coordinates.
M(x, y): M is the name of the point, x is the abscissa and is measured on Ox and y is the ordinate and is measured on Oy.
The two coordinates represent the distances from the point to the two axes.
If we consider a function f: A -> B (A - domain of definition, B - codomain), then a point found on the graph of the function is of the form P(x, f(x)).
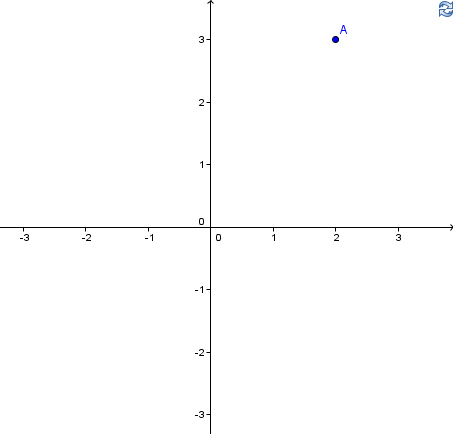
Example
f:A -> B, f(x) = 3x - 1
If x = 2 => f(2) = 3×2 - 1 = 5 => P(2, 5) ∈ Gf(where Gf is the graph of the function).
The Quadratic Function - Parabola
Standard form: f(x) = ax2 + bx + c
Vertex form: $f(x)=(a+\frac{b}{2a})^2-\frac{\Delta}{4a}$
where Δ = b2 - 4ac
If a > 0, the minimum value of f(x) will be $-\frac{\Delta}{4a}$ which is obtained if $x=-\frac{b}{2a}$. The graph will be a convex parabola which vertex (the point where the parabola turns) is $V(-\frac{b}{2a};-\frac{\Delta}{4a})$.

If a < 0, the maximum value of f(x) will be $-\frac{\Delta}{4a}$ which is obtained if $x=-\frac{b}{2a}$. The graph will be a concave parabola whose vertex is $V(-\frac{b}{2a};-\frac{\Delta}{4a})$.

The parabola is symmetric about the line that intersects $x=-\frac{b}{2a}$,
which is called the "axis of symmetry".
That is the reason why, when we assign values to x, we
choose values symmetric about $-\frac{b}{2a}$.
When drawing a graph, the points of intersection with the coordinate axes are very important.
|. A point found on the Ox axis is of the form P(x, 0) because the distance from it to Ox is 0. If the point is found both on Ox and the graph of the function, it is also of the form P(x, f(x)) ⇒ f(x) = 0.
Thus, to find the coordinates of the points of intersection with the Ox axis, we must solve the equation f(x)=0. We get to the equation a2 + bx + c = 0.
The solutions of the equation depend on the sign of Δ = b2 - 4ac.
We have the following situations:
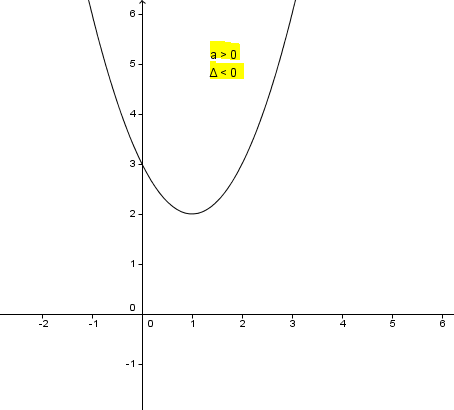
1) Δ < 0
the equation has no solutions in R (the set of real numbers) the graph doesn't intersect Ox. The form of the graph will be:
or

2) Δ = 0
the equation has two equal solutions $x_1=x_2=-\frac{b}{2a}$
The graph is tangent to the Ox axis in the vertex of the parabola. The form of the graph is:

or

3) Δ > 0
the equation will have two different solutions.
$x_1=\frac{-b-\sqrt{\Delta}}{2a}$ and $x_2=\frac{-b+\sqrt{\Delta}}{2a}$
The graph of the function will intersect the Ox axis in points M(x1 and Ox. The form of the graph will be:

or

||. A point found on the Oy axis is of the form R(0, y) because the distance from it to Oy is 0. If the point is found both on Oy and the graph of the function, it is also of the form R(x, f(x)) ⇒ x = 0 ⇒ R(0, f(0)).
In the case of the quadratic function,
f(0) = a×02 + b×0 + c ⇒ R(0, c).
The necessary steps to draw the graph of a quadratic function
f: R → R
f(x) = ax2 + bx + c
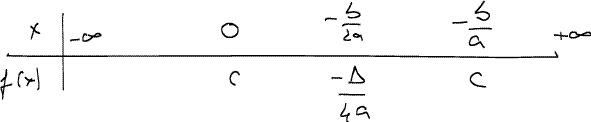
1. We draw a table of variables in which we write some important values for x.

2. We find out the coordinates of the vertex $V(-\frac{b}{2a};-\frac{\Delta}{4a})$.

3. We also write 0 in the table and the symmetric of 0 about $-\frac{b}{2a}$.
or

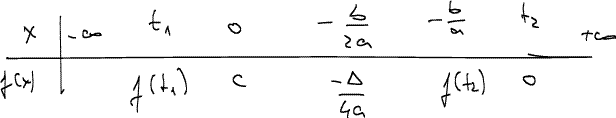
4. We determine the point of intersection with the Ox axis by solving the equation f(x)=0 and we write x1 and x2 in the table.
Δ > 0 ⇒

Δ < 0 ⇒ there are no points of intersection. In this case we'll choose two convenient values symmetric about $-\frac{b}{2a}$
Δ = 0 ⇒ the graph is tangent to Ox right in its vertex. We'll choose once again two convenient values symmetric about $-\frac{b}{2a}$. To better determine the form of the graph we can also choose other pairs of values for x, but they must also be symmetric about $-\frac{b}{2a}$.
5. We write all these values in the coordinate system and we draw the graph by connecting the points.
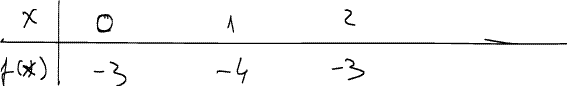
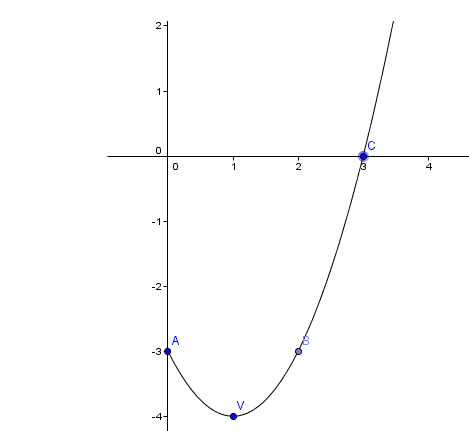
Example 1
f: R → R
f(x) = x2 - 2x - 3
a = 1, b = -2, c = -3
Δ = b2 - 4×a×c = (-2)2 - 4×1×(-3) = 16
$-\frac{b}{2a}=\frac{2}{2}=1$
⇒ V(1; -4)
1. $-\frac{\Delta}{4a}=-\frac{16}{4}=-4$
2. f(0) = -3
The symmetric of 0 about 1 is 2.
f(2) = -3
Δ = 16 > 0
$x_1=\frac{-b-\sqrt{\Delta}}{2a}=\frac{2-4}{2}=-1$
$x_1=\frac{2+4}{2}=3$

We have found the points:
A(-1; 0)
B(0; -3)
V(1; -4)
C(2; -3)
D(3; 0)
The graph will be:

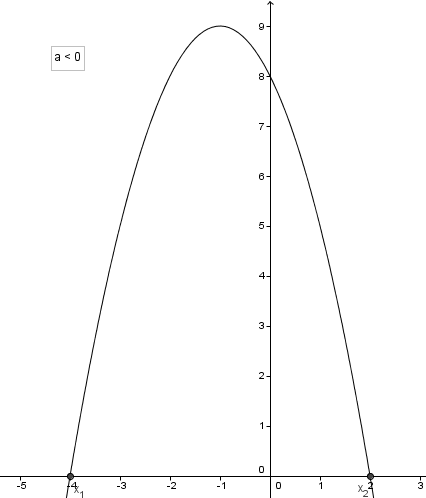
Example 2
f: R → R
f(x) = -x2 - 2x + 8
a = -1, b = -2, c = 8
Δ = b2 - 4×a×c = (-2)2 - 4×(-1)×8 = 36
$-\frac{b}{2a}=\frac{2}{-2}=-1$
⇒ V(-1; 9)
1. $-\frac{\Delta}{4a}=-\frac{-36}{-4}=9$
2. f(0) = 8
f(-2) = 8 (the symmetric of 0 about -1 is -2)
3. f(x) = 0 ⇒ -x2 - 2x + 8 = 0
Δ = 36
x1 = 2 and x2 = -4

A(-4; 0)
B(-2; 8)
V(-1; 9)
C(0; 8)
D(2; 0)
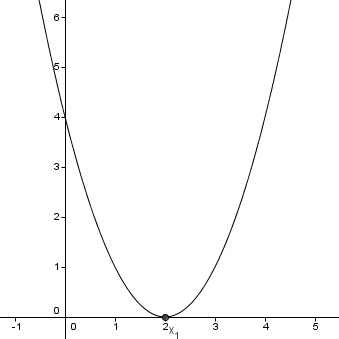
Example 3
f: R → R
f(x) = x2 - 4x + 4
a = 1, b = -4, c = 4
Δ = b2 - 4×a×c = (-4)2 - 4×1×4 = 0
$-\frac{b}{2a}=\frac{4}{2}=2$
⇒ V(2; 0)
1. $-\frac{\Delta}{4a}=0$
2. f(0) = 4
f(4) = 4 (the symmetric of 0 about 2 is 4)
3. f(x) = 0 ⇒ x2 - 4x + 4 = 0
Δ = 0
x1 = x2 = $-\frac{b}{2a}$ = 2

A(-2; 9)
B(0; 4)
V(2; 0)
C(4; 4)
D(5; 9)
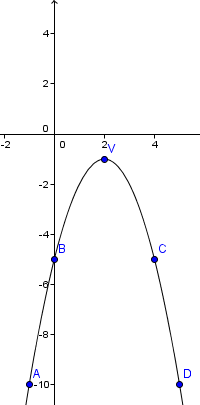
Example 4
f: R → R
f(x) = -x2 + 4x - 5
a = -1, b = 4, c = -5
Δ = b2 - 4×a×c = 42 - 4×(-1)×(-5) = 16 - 20 = -4
$-\frac{b}{2a}=\frac{-4}{-2}=2$
⇒ V(2; -1)
1. $-\frac{\Delta}{4a}=-\frac{-4}{-4}=-1$
2. f(0) = -5
f(4) = -5 (the symmetric of 0 about 2 is 4)
3. f(x) = 0 ⇒ -x2 + 4x - 5 = 0,
Δ < 0
The equation doesn't have any solution.
We have to choose values symmetric about 2
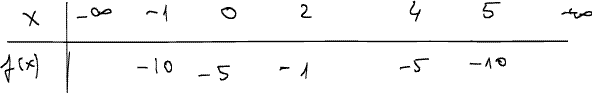
A(-1; -10)
B(0; 5)
V(2; -1)
C(4; -5)
D(5; -10)
If the domain of definition is not R (the set of real numbers), but an interval, we erase the part of the graph corresponding to the values of x that aren’t found in the interval. It is necessary to write the endpoints in the table.
Example 5
f: [0; +∞) → R
f(x) = x2 - 2x - 3
a = 1, b = -2, c = -3
Δ = b2 - 4×a×c = (-2)2 - 4×1×(-3) = 16
$-\frac{b}{2a}=1$
⇒ V(1; -4)
1. $-\frac{\Delta}{4a}=-4$
2. f(0) = -3
f(2) = -3 (the symmetric of 0 about 1 is 2)
3. f(x) = 0 ⇒ x2 - 2x - 3 = 0,
Δ = 16
x1 = -1 ∉ [0; ∞)
x2 = 3
A(0; -3)
V(1; -4)
B(2; -3)
C(3; 0)
How to create a parabola - animated

